a $100 million betting market prices oil like the CME options floor?
Part 1 of an ongoing series.
This is the first post of a longer series on a project comparing prediction markets and traditional markets, and looking at exploitation opportunities. This post will map out the terrain: venues, contracts, why naive comparisons fail, and an important finding that recalibrated the project. This project required some collaboration with relevant industry experts (which will be referenced in later posts).
This past Spring, while the Strait of Hormuz was the most dangerous shipping lane on earth, two very different groups of people were pricing the same question. On one side: the CME crude options complex - the professional venue backed by half a century of market infrastructure, and hundreds of listed strikes per expiry. On the other: pseudonymous accounts on a crypto betting site, wagering on questions such as "will WTI hit $110 in May?" at prices that read directly as probabilities.
The premise of the project is simple: when two venues price the same event under different mechanics, clienteles, and constraints, the difference between them is information - about risk premia, behavioural bias, market structure, and occasionally money left on the table. First we need to establish an accurate comparison - which is what this first post details.
Three objects, one name
Of course, the 'price of oil' is not just one number - WTI crude trades as three legally and mechanically distinct objects.
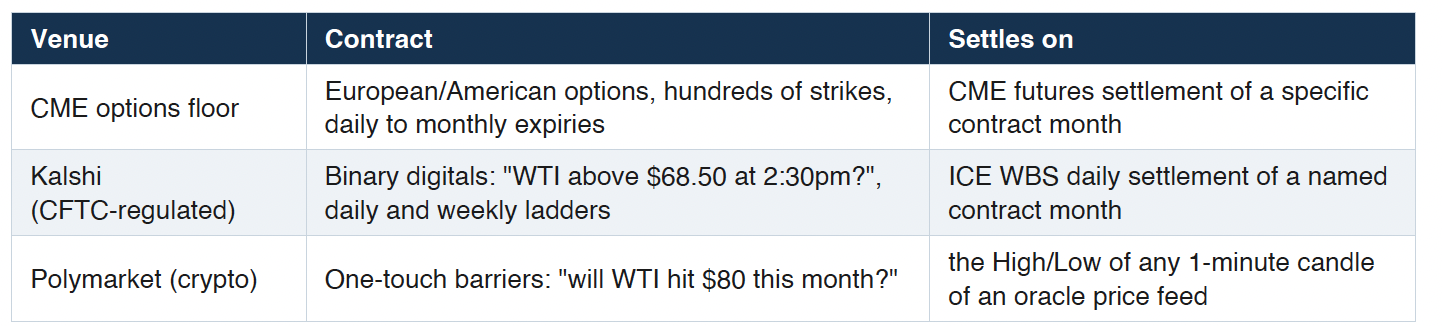
Three details are immediately important:
- Kalshi settles on ICE, the models price CME - measuring this, we find that the prices are identical to the cent on all 46 dates where both exist.
- Each market names a specific futures month - the solution to this is simple; in the project, every fair value prices the named month, without exception.
- The types of contracts are different - a touch-contract and a terminal contract are not the same question phrased differently - the probabilities are inherently very different, and require completely separate models for evaluation.
Where naive comparisons fail
- Fees - deterministic formulas on both platforms that can be imposed exactly.
- Funding - one venue pays interest on both cash and open positions, the other pays nothing for the relevant markets. As such an identical long-dated contract carries a different rational discount on each platform.
- Measure - an option implies a risk-neutral probability, whilst a bet is approximately a real-world one; so the two differ by a risk premium that is not noise and not mispricing either.
- Settlement - this is something that is very rarely considered, and perhaps rightly so. Measuring how far the 1-minute candle extremes stray from the real traded range produces a negligible result mid-session, but is occasionally spectacular at session reopens. This concept deserves its own additional exploration in a separate post.
The library
The engineering discipline behind those principles is the product thus far - a tested library where every pricing path is cross-checked against closed forms and Monte Carlo by an independent adversarial pass (473 automated tests, running on 15 million rows of minute-level quotes, settlement prints, and oracle candles archived from free but perishable sources). Two of the used datasets are actually deleted on a schedule (this will be the object of a future post looking into perishable data and reverse-engineering).
Three months of live data
Looking at the three months of live data, the headline is relatively clear - the crowd does not seem to be wrong.
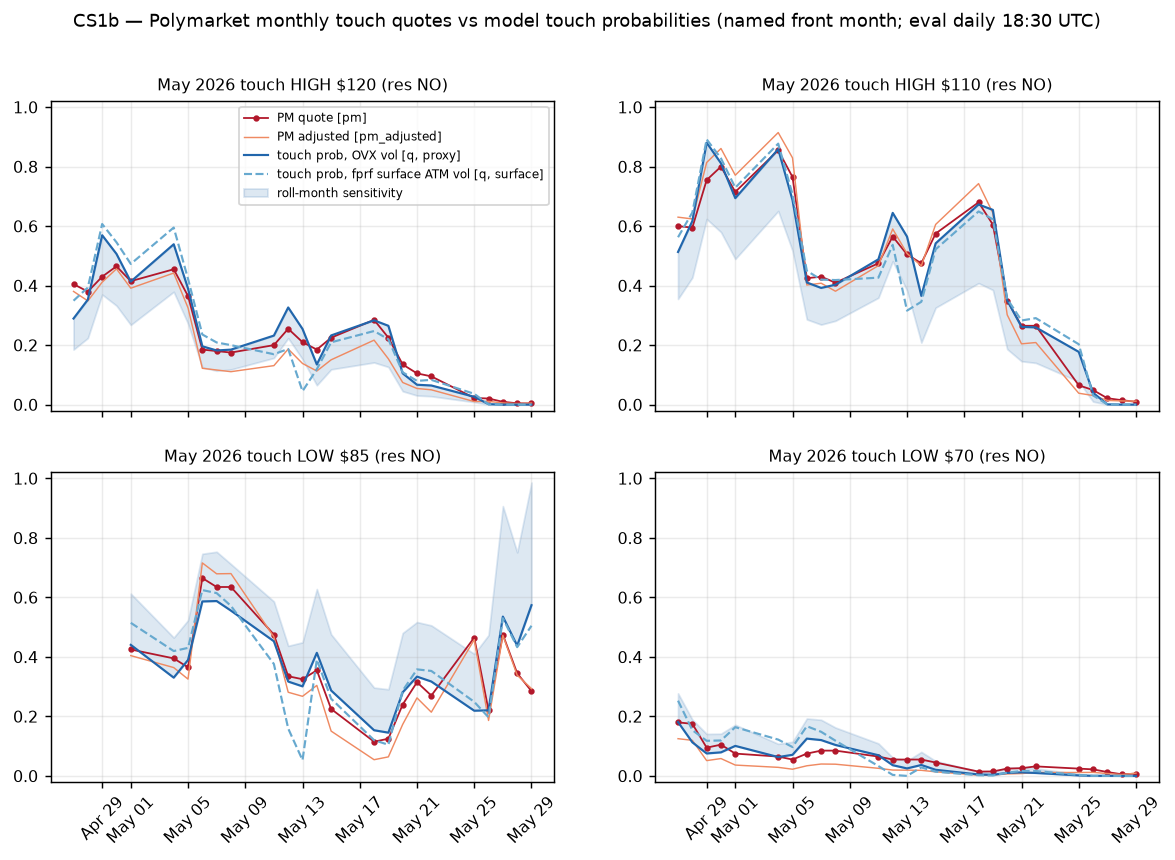
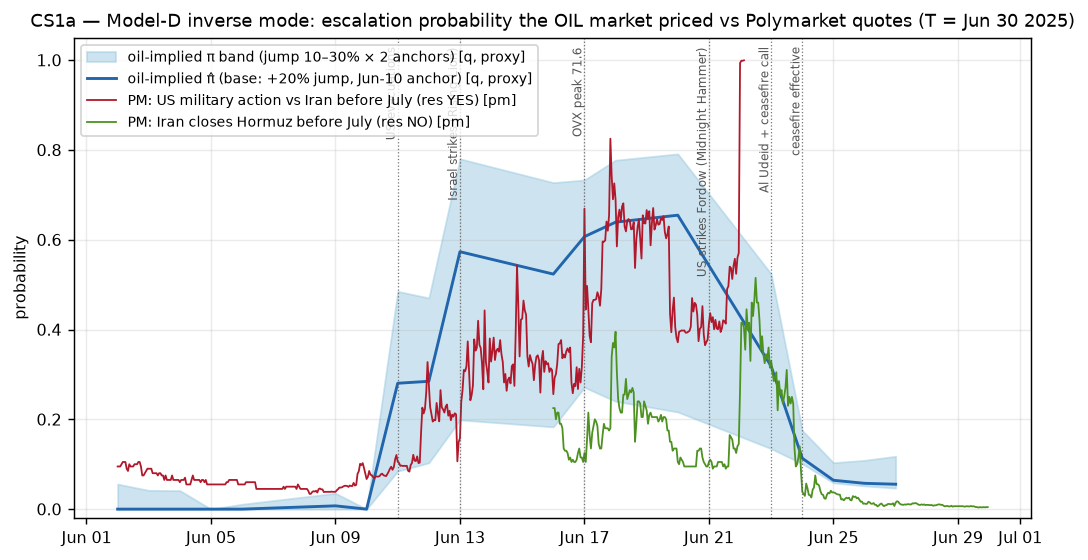
Agreement here, however, does not suggest that the two worlds are the same market. The June 2025 war made the distinction vivid, with Polymarket running liquid markets on "US military action against Iran before July"; oil ran its own referendum on the same events. Inverting the option-implied distribution through an event-mixture model lets you ask what escalation probability the oil market was pricing. The answer diverged from the event contracts in both directions at different times, with oil moving a day earlier on the initial escalation. Then, after the US strike, the event contract resolved YES at 1.0 while oil unwound its entire war premium in two sessions, because the realized strike did not disrupt supply. Both were 'right' but they priced different objects - a named and straightforward indicator versus a supply-disruption bundle. Scoring one against the other would be a category error.
What the agreement does not show
A clean null at the aggregate level is certainly not the end of the story, but instead is the beginning of a more interesting one. Underneath the zero mean, the disagreement between the venues has a real structure, varying systematically with moneyness, time to resolution, and contract type. Where structure looks persistent, I have pre-registered hypotheses and am tracking them against live resolutions (rather than positions). The anatomy of that structure is another interesting thread to explore in a future post.
What's next
My next post on this will likely be looking at the free per-strike volatility data hiding in CME's public settlement files, and how its undocumented convention can be reverse engineered for valuable and typically expensive data. This will be accompanied by a deeper dive into data that perishes on a schedule. Further forwards, I would also like to analyse what changes to structure under agreement occur during a non-war period.